
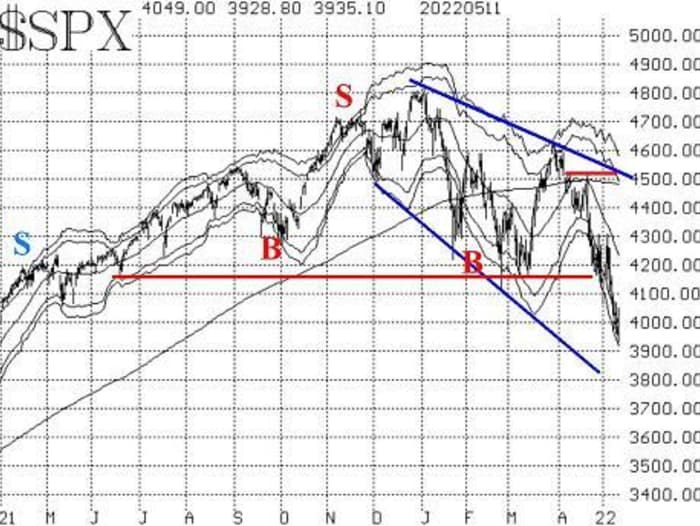
This past week, the S&P 500 index plunged to new relative lows. It is now trading at prices last seen in March 2021. This latest move downward violated support at 4100-4200 and prompted a swift move down toward possible support at 3900. The next support area below that is 3700 – the lows of February and March 2021 .
The S&P SPX,
is quite oversold, although as readers know, “oversold does not mean buy.” Even so, oversold rallies accompany bear markets. They usually top out at about the level of the declining 20-day moving average or perhaps slightly above that.
The bulls have tried to engineer a couple of oversold rallies of late, but they turned out to be one-day affairs that – while looking spectacular for one day – had no staying power. Those occurred on April 28 and May 4.
Currently, the 20-day moving average is at 4240 and dropping rapidly. Above that, those two one-day rallies topped out near 4300, so that general area of 4240-4300 represents resistance.
Lawrence McMillan
So far, SPX has not set up a new McMillan Volatility Band (MVB) buy signal, because it has not closed above 4308. It would set up a new signal at lower levels if it could close below the -4σ “modified Bollinger Band. ” It has not been able to do that.
In fact, SPX has been “walking” down the narrow alley between the -3σ and -4σ Bands. Those Bands are dropping more rapidly now because realized volatility has increased substantially. The S&P’s 20-day historical (realized) volatility is 31% – a very high level.
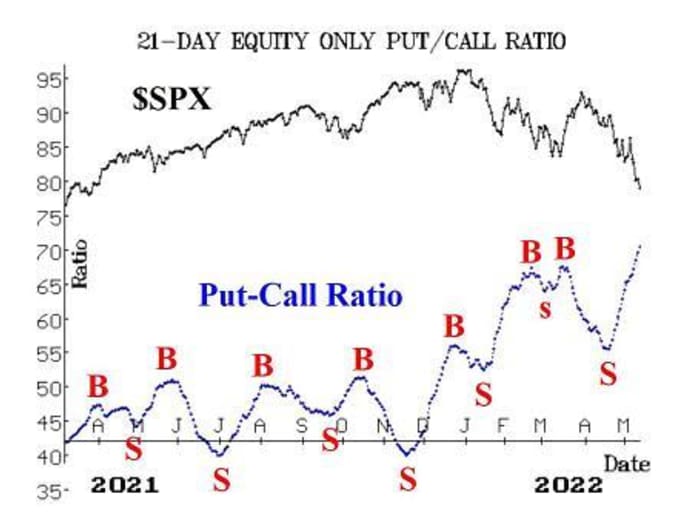
Equity-only put-call ratios continue to rise sharply, and that means they are still on sell signals. They will only generate buy signals when they roll over and begin to decline. This is the highest level that they have been at since March 2020, and they are certainly in oversold territory, but they are not yet on buy signals.
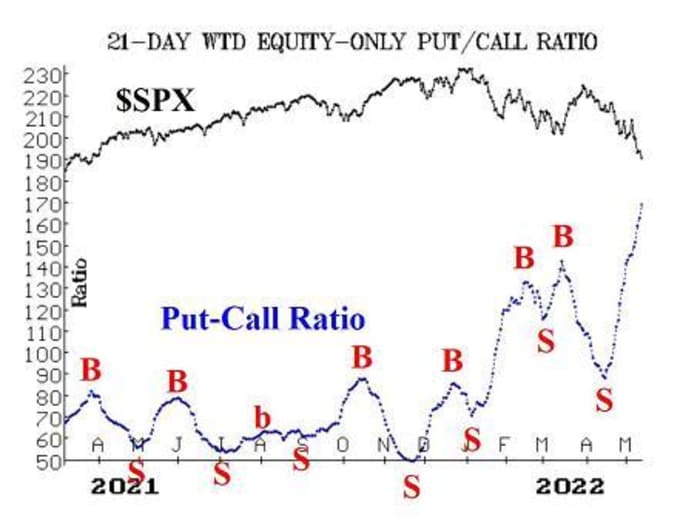
Meanwhile, the total put-call ratio finally registered a reading above 1.00 on one day this past week. A buy signal from that indicator does not normally occur until its 21-day moving average reaches 0.90 or higher. At this time, it is 0.837 – so it is not near a buy signal either.
Lawrence McMillan
Lawrence McMillan
Market breadth has been poor, as one might imagine. There was another “90% down day” on May 5. Both breadth oscillators are on sell signals and are deeply oversold. These oscillators are at nearly the same levels as they were in late January, when an oversold rally did occur – but the market’s psyche was in a much more bullish place in late January than it is now.
In any case, it is going to take at least two or three days of positive breadth (ie, more advances than declines) for these to roll over to buy signals.
New 52-week lows continue to obliterate new 52-week highs. One day this week saw only 5 new highs on the NYSE. This indicator remains bearish and deeply oversold. It would take two days on which new highs exceed new lows on the NYSE to turn this bullish. That can happen sooner than one might think, but it does not seem to be in the cards at this time.
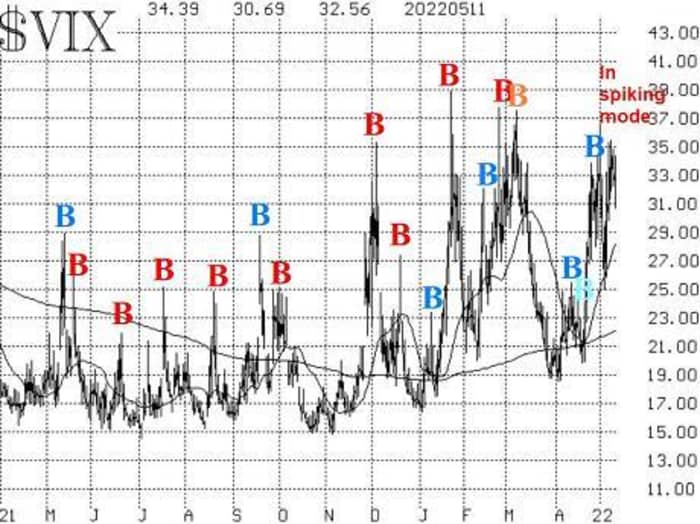
The most recent VIX “spike peak” buy signals have been stopped out, but that also means that VIX VIX,
is back in “spiking mode.” Thus, a new “spike peak” buy signal will set up soon. This indicator is quite sensitive to oversold reversals, and thus is usually one of the first bullish indicators in a declining market.
So far, though, the recent signals have been losing ones (blue “B’s” on the accompanying VIX chart are losing “spike peak” buy signal trades, but the system that we use to trade this indicator). This is somewhat typical action during bearish markets, and the last time it happened was March-April 2020.
Lawrence McMillan
The trend of VIX remains bearish for stocks, as both VIX and its 20-day moving average are above the 200-day MA. That would only be interrupted by VIX closing below the 200-day, which is not going to happen anytime soon, since the 200-day is at about 22 (and slowly rising).
The construct of volatility derivatives has turned modestly negative in its outlook for the stock market, and it is struggling to keep from turning seriously negative. The front-month May VIX futures is trading fractionally higher than the June futures. If May rises more than 1.00 points above June, that would generate a more serious sell signal.
Meanwhile, the term structure of the VIX futures is sloping downward modestly, which is another mild negative for stocks. If that term structure inverts steeply, it would generate an intermediate-term sell signal for stocks.
Overall, VIX and its derivatives have not been responding the way one would normally expect to see in a bearish market. VIX has not even probed above 40 yet, and the term structure continues to remain relatively flat. Sometimes this happens – most noticeably in February and March of 2009, when VIX remained flat (albeit at the 55 level) while the stock market plunged to the bear market lows. A less severe, but similar, case occurred in December 2018 as well.
In summary, we continue to retain a “core” bearish position and will do so as long as the trends of SPX (downward) and VIX (upward) are in place. We will trade oversold buy signals around that “core” position, but only if they are confirmed signals.
New recommendation: Potential VIX ‘spike peak’ buy signal
The highest price that VIX has reached since stopping out the previous buy signal was 35.48 on May 9. A new VIX “spike peak” buy signal will occur when VIX closes at least 3.00 points below the highest price that it has reached, using price of May 9 and thereafter.
IF VIX closes at least 3.00 points below the highest price that it reached from May 9 forward,
THEN buy 1 SPY June (17th) at-the-money call
And sell 1 SPY June (17th) call with a striking price 20 points higher.
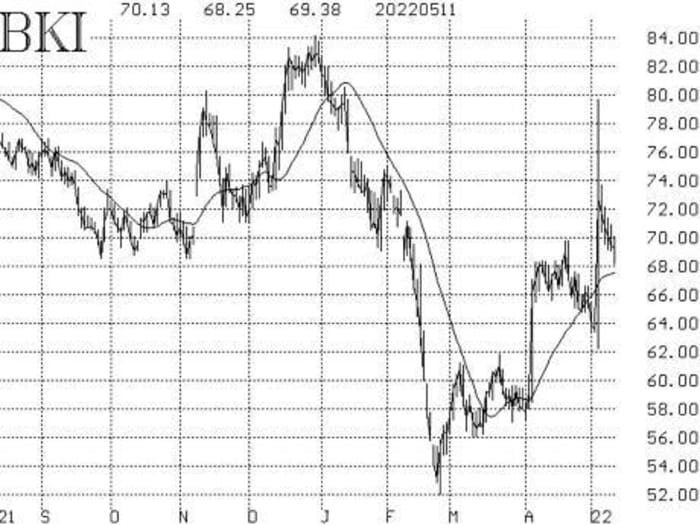
New Recommendation: Black Knight (BKI)
A takeover bid from The Intercontinental Exchange ICE,
was accepted by Black Knight BKI,
that was supposedly “worth” $85. In reality, it is less than that, because part of the deal is for ICE stock, which has plummeted since the deal was announced.
Digging through the news release, it appears that the deal is 80% cash at $63.20, plus 20% in ICE stock. So the deal is 63.20 + 0.2 * ICE, which is worth $82.11 with ICE trading at 94.55. BKI is trading at 69.34, which is a very wide spread. So we are going to buy BKI calls, looking for the spread to narrow.
Buy 3 BKI June (17th) 70 calls
At a price of 2.50 or less.
BKI: 69.44 June (17th) 70 call: offered at 3.00
We will hold without a stop initially.
Lawrence McMillan
Follow up action
All stops are mental closing stops unless otherwise noted.
We are going to implement a “standard” rolling procedure for our SPY spreads: in any vertical bull or bear spread, if the underlying hits the short strike, then roll the entire spread. That would be roll up in the case of a call bull spread, or roll down in the case of a bear put spread. Stay in the same expiration, and keep the distance between the strikes the same unless otherwise instructed.
Long 2 ZEN May (20th) 125 calls and Short 2 May (20th) 140 calls: The stock gapped to the upside when Zendesk ZEN,
began to evaluate strategic alternatives. Hold without a stop while the activist activity is in progress.
Long 3 SAVE May (20th) 25 calls: Hold without a stop for now, as competing bids are still in place for Spirit Airlines SAVE,
Long 2 ENV May (20th) 80 calls: Continue to hold without a stop while the takeover rumors play out.
Long 2 SPY May (20th) 401 puts and Short 2 SPY May (20th) 376 putts: We originally bought this spread in line with the sell signal from the trend of VIX. It was rolled down when SPY traded at 401 on May 9. We will hold this spread as long as VIX remains above its 200-day moving average, which is currently at about 22.
Long 0 SPY May (27th) 428 call and short 0 SPY May (27th) 443 calls: This spread was bought on April 28, the day that the latest VIX “spike peak” buy signal occurred. It was stopped out on Monday, when VIX closed above 33.81.
Long 4 MAT May (20th) 25 calls: We bought these because of the takeover rumors that have been spreading. The closing, trailing stop remains at 24.
Long 0 CHK May (20th) 95 calls: These calls were bought last week and were then stopped out on Monday, when Chesapeake Energy CHK,
closed below 86.
Send questions to: [email protected].
Lawrence G. McMillan is president of McMillan Analysis, a registered investment and commodity trading advisor. McMillan may hold positions in securities recommended in this report, both personally and in client accounts. He is an experienced trader and money manager and is the author of the bestselling book “Options as a Strategic Investment.”
Disclaimer: ©McMillan Analysis Corp. is registered with the SEC as an investment advisor and with the CFTC as a commodity trading advisor. The information in this newsletter has been carefully compiled from sources believed to be reliable, but accuracy and completeness are not guaranteed. The officers or directors of McMillan Analysis Corp., or accounts managed by such persons may have positions in the securities recommended in the advisory.
.